
About This Project
The goal for this project was to visualize a portion of the Emergency Preparedness Survey results from Professer Shireen Hyrapiet's 2016 and 2017 Geography of Disaster Management course.
The survey was created by Professor Hyrapiet, and students disbursed the survey throuhout their social networks using social media, direct links, and email lists of their friends and family.
The Map
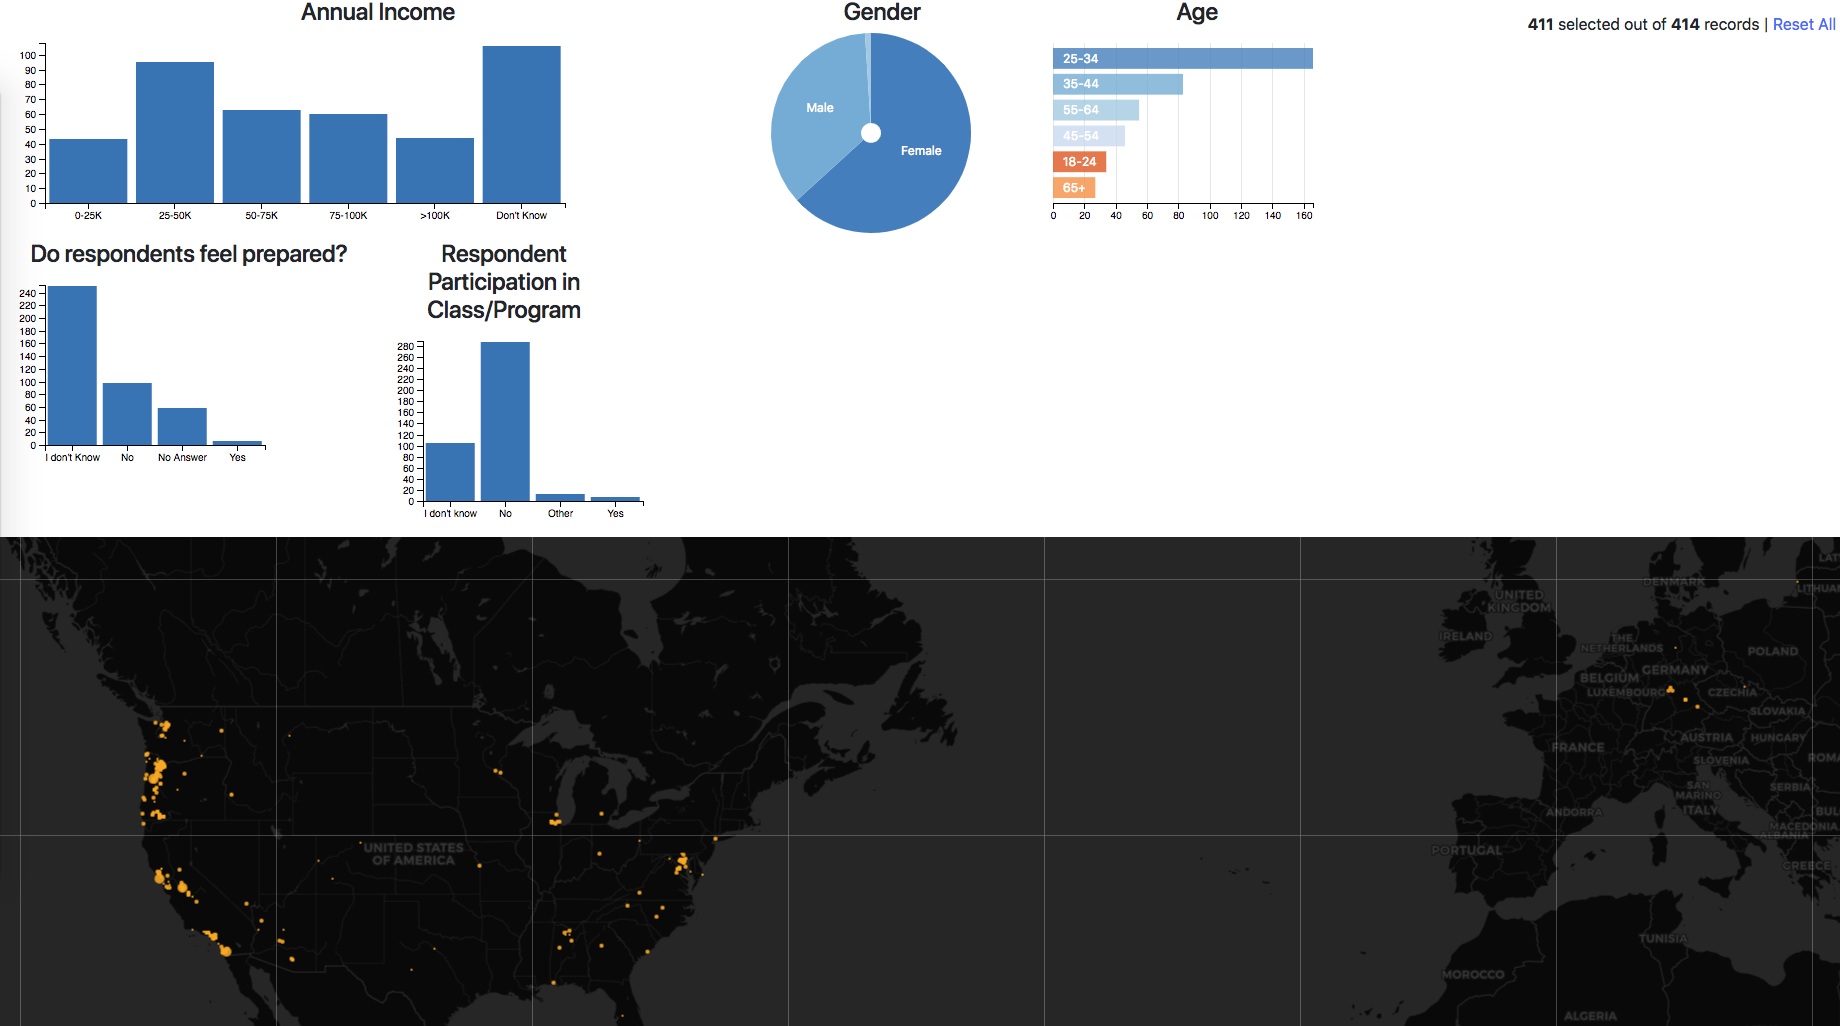
The displayed maps show responses from reported zip codes. Demographic data such as Age, Gender, Annual Income, and Zip Code were recorded. Zoom in on location on the map to view the respondents survey response information for that area.
Responses to the survey were filtered to show only demographic information, whether or not a emergency preparedness class (through school, community centers, or by some other means) has ever been completed, and the respondents feelings of preparedness if a natural disaster were to occur in close proximity. Future plans include visualizing the remainder of responses to more disaster-based questions.
Methodology
This project was created in order to provide a visualization of student sruvey data, and to provide an easier means of looking
The data was geocoded using zip code responses from survey respondents into a csv file, and then converted to a geoJson format.
In order to collect the geographical data, the latitude and longitude coordinates were collected for each zip code response. The responses were converted
to numerical values for easier coding reference. Visualization was done using d3 chart templates with the addition of data filters using survey data responses. The
filtering allows users to view the data with ease through desktop browsers.
Advisors
Bo Zhao
Professor at Oregon State University
Bo specializes in Cartography and geovisual analytics, and has mentored me in writing code and debugging it throughout the course of this project.
Team
Christine Shook-Abaricia
Student
Senior in the College of Earth, Ocean, and Atmospheric Sciences majoring in Geography and Geospatial Science. I attended class with Professor Shireen Hyrapiet regarding disaster management, where the topic of mitigation strategies peaked my interest. I hoped to begin visualizing the data collected through that class into a useful and interesting resource for future students.
Acknowledgements
- Jared Ritchey, TA GEOG 472/572 and Masters Student
- Shireen Hyrapiet, Professor | Oregon State University Geography Department
- Classmates of GEOG 472/572 for their critique and support throughout the term.
Credits
This project utilized the following libraries: colorbrewer.js, Bootstrap, Leaflet, D3, Crossfilter,DC, jqCloud, and Cloudflare.
Supporting Organizations